
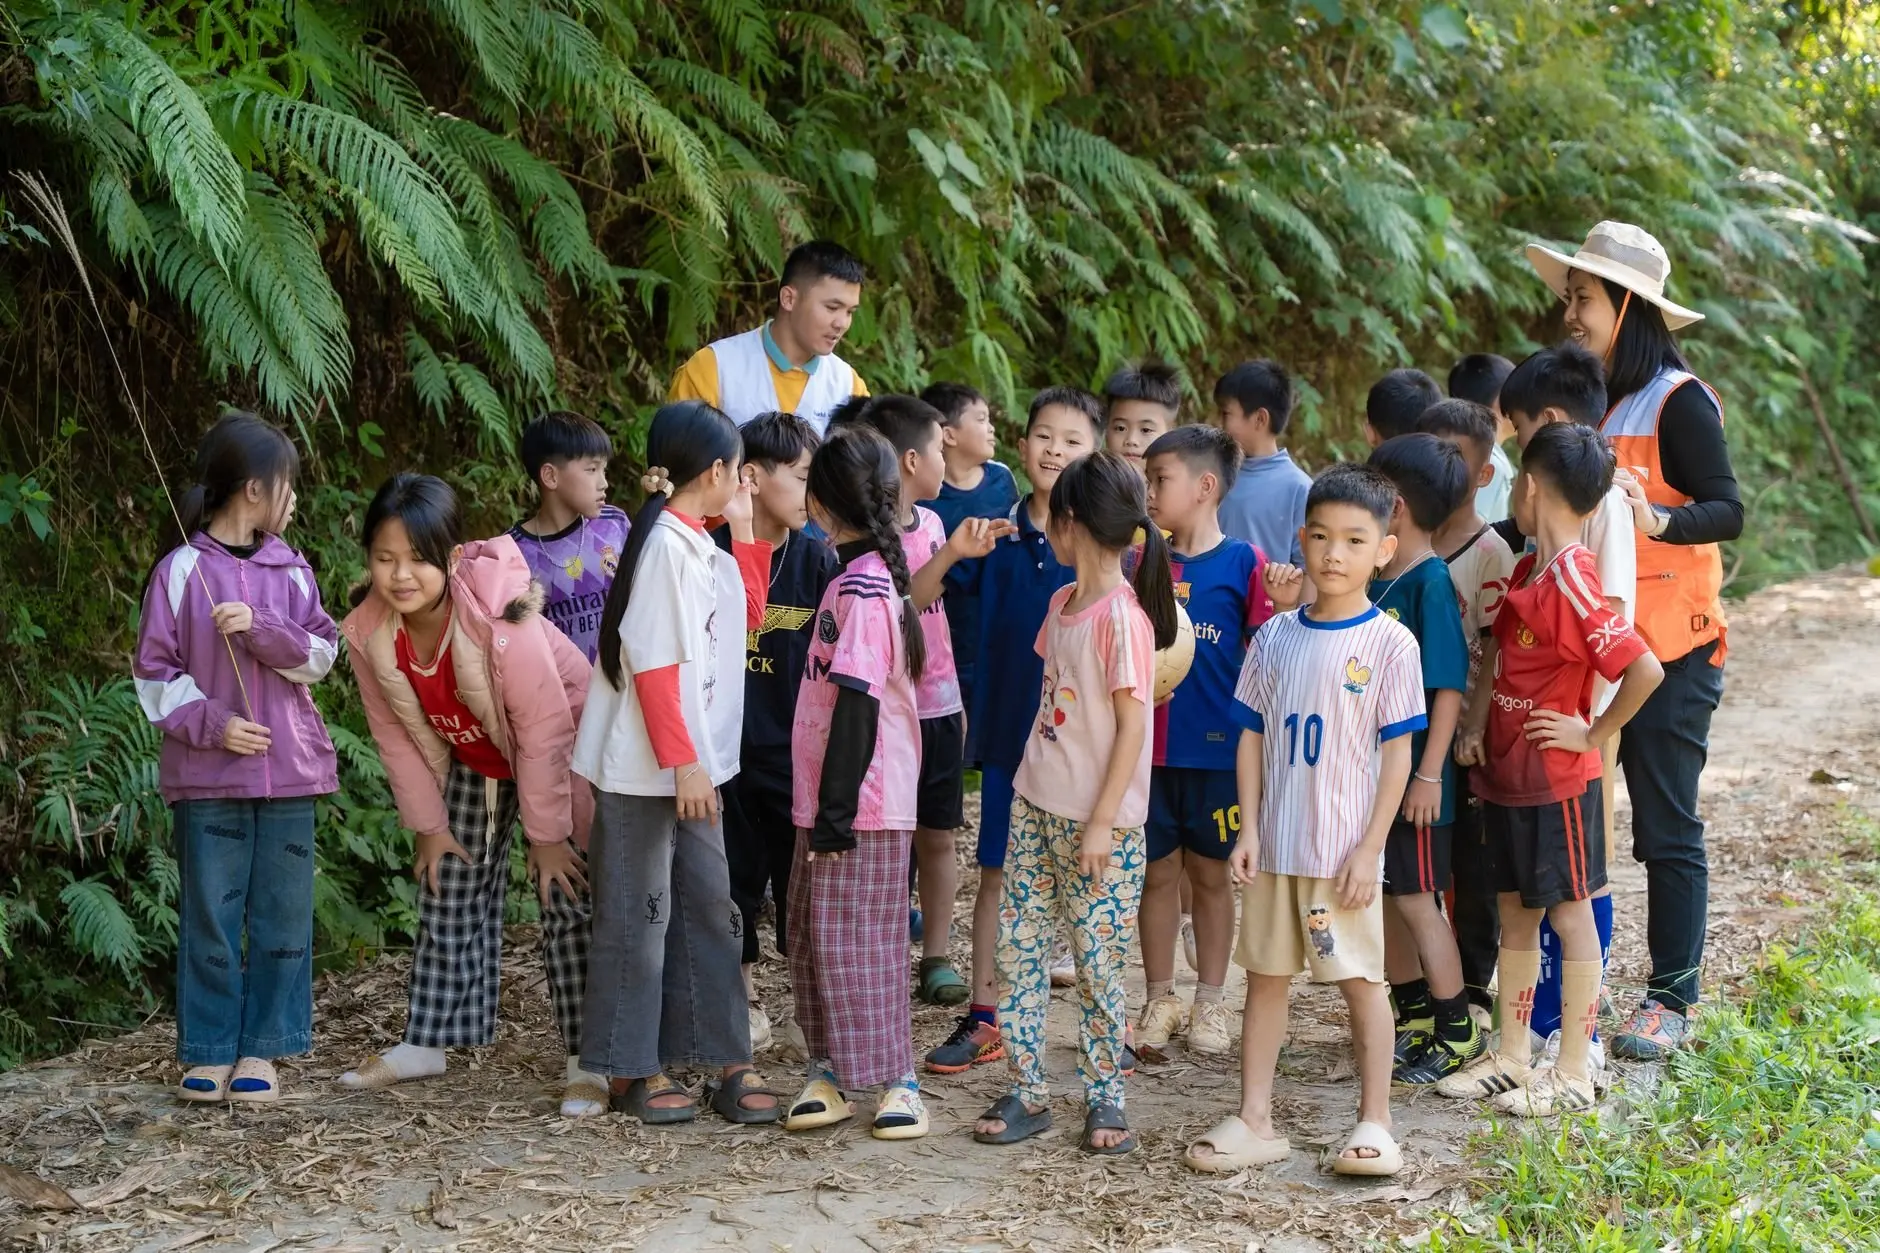
Teaching biodiversity to students works best when you first decide whether the class will observe, count or test. Start with a small outdoor survey, record the data in one shared format, and let a testable question grow from what students actually find.
This guide helps you pick that starting point and build from it. If you want ready-made activities, the biodiversity lesson plans for middle school are the quickest route, and how to do a schoolyard biodiversity survey covers the most accessible fieldwork.
Choosing your starting point
The right first lesson depends on three things: how much outdoor time you have, how confident students are with identification, and whether you need to meet a particular standard. Answer those honestly before you pick an activity, because a lesson that is too ambitious for the setting produces messy data and little learning.
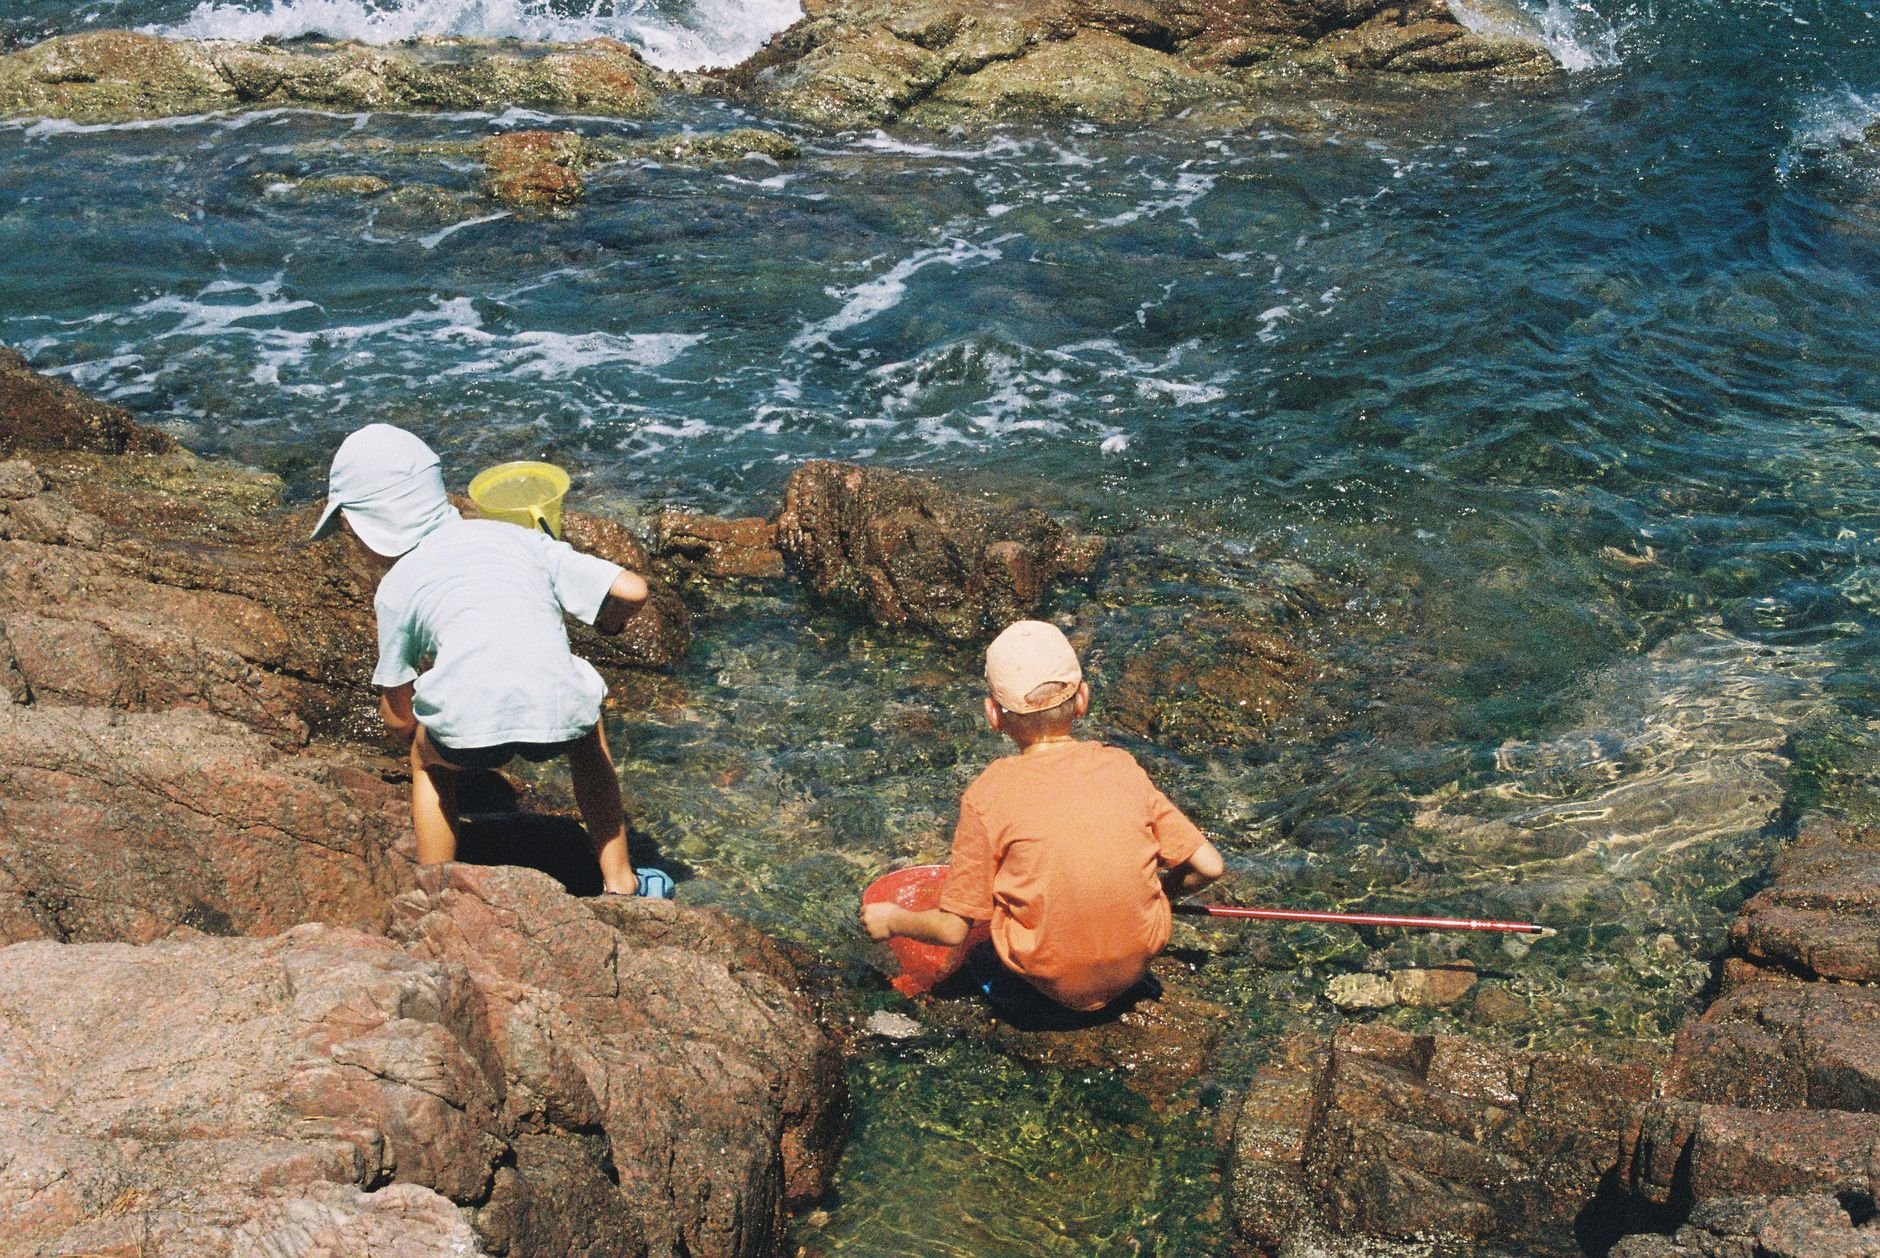
- You have a short block and an indoor-heavy schedule. Begin with a concept lesson on what biodiversity is, then send students outside to observe in a following session. Published classroom material for grades 7-9 runs for 30-40 minutes, which shows that a focused introduction can fit inside a single short period.
- You have access to a schoolyard, park edge or garden. Begin with a counting survey. Students tally the kinds of plants or animals in a marked area, which gives them real numbers within one visit.
- Your students already count and identify confidently. Move straight to a comparison. Ask whether two areas differ, and have the class design how to find out.
- Your students are new to outdoor work. Start with observation and notebooks before any measurement. Careful looking and drawing build the habits that make later data trustworthy.
- You want to connect to invasive species. Run a baseline survey first. Students cannot recognise a problem species until they know what normally grows and lives in the area.
Whichever route you choose, keep the same sequence: observe, record, compare, question. That sequence is the backbone of inquiry based science teaching outdoors, and it lets you add complexity one layer at a time rather than all at once.
What biodiversity means in the classroom
Biodiversity, in the simple form that suits most classes, is the variety of different species found within a particular ecosystem or community, as the Canadian Parks and Wilderness Society Southern Alberta education program puts it. Using that single sentence as the working definition keeps the whole class measuring the same thing.
A definition that students can count against is more useful than a broad one. Variety of species can be tallied in a quadrat, along a path or in a pond sample. Wider ideas such as genetic variety or ecosystem variety are real, but they are hard to measure with a clipboard, so introduce them in discussion rather than data collection.
Why the idea matters to students
Students engage more when they can say why variety matters. The same education program treats an endangered or extinct species as an important indicator that biodiversity is being lost. That gives you a natural bridge from counting to caring: the class counts species now, then asks what would show that the count was falling.
The program’s lesson also asks students to brainstorm reasons biodiversity has value, then describe a local example of one reason using three to five facts discovered through research. That structure is worth borrowing. It stops the discussion from staying abstract and ties each claim to something students can look up or observe near school.
Common misunderstandings to head off
- Biodiversity is not the same as abundance. A patch with many individuals of one plant is not diverse. Make students count kinds, not just numbers of things.
- A bare-looking site still has something to record. Unpromising ground makes a useful comparison with a richer area, so do not avoid it.
- More species is not automatically better for every purpose. Treat it as a measurement to interpret, and ask what the species are before drawing conclusions.
Measuring biodiversity with students
Students can measure biodiversity by recording which species are present in a defined space and counting how many different kinds they find. This is the entry point; fancier calculations come later and only if the class is ready. For the next step, how to measure biodiversity for students explains indices that suit a classroom.
Define the space before you count
A count only means something if everyone sampled the same sort of area. Use a quadrat, a marked transect line or a clearly bounded patch, and have every group use the same size and method. When groups improvise their own boundaries, their numbers cannot be pooled or compared, and the discussion afterwards turns into an argument about method rather than ecology.
Count kinds, then decide how to handle uncertainty
Students will meet organisms they cannot name. Teach them to give an unknown a working label such as “plant A” with a sketch and a note, and to treat it as a separate kind. This keeps the richness count honest and gives you something to resolve with a field guide afterwards. It also models how working scientists handle uncertainty.
Use a model to make the idea stick
Before or after fieldwork, a hands-on model can show what the numbers imply. The biodiversity jenga activity lets students remove pieces to represent species loss and watch how a structure responds. It works well as a bridge to the indicator idea above, because students see why losing species is a warning sign, then return outside to measure the real thing.
Sort and classify back at the table
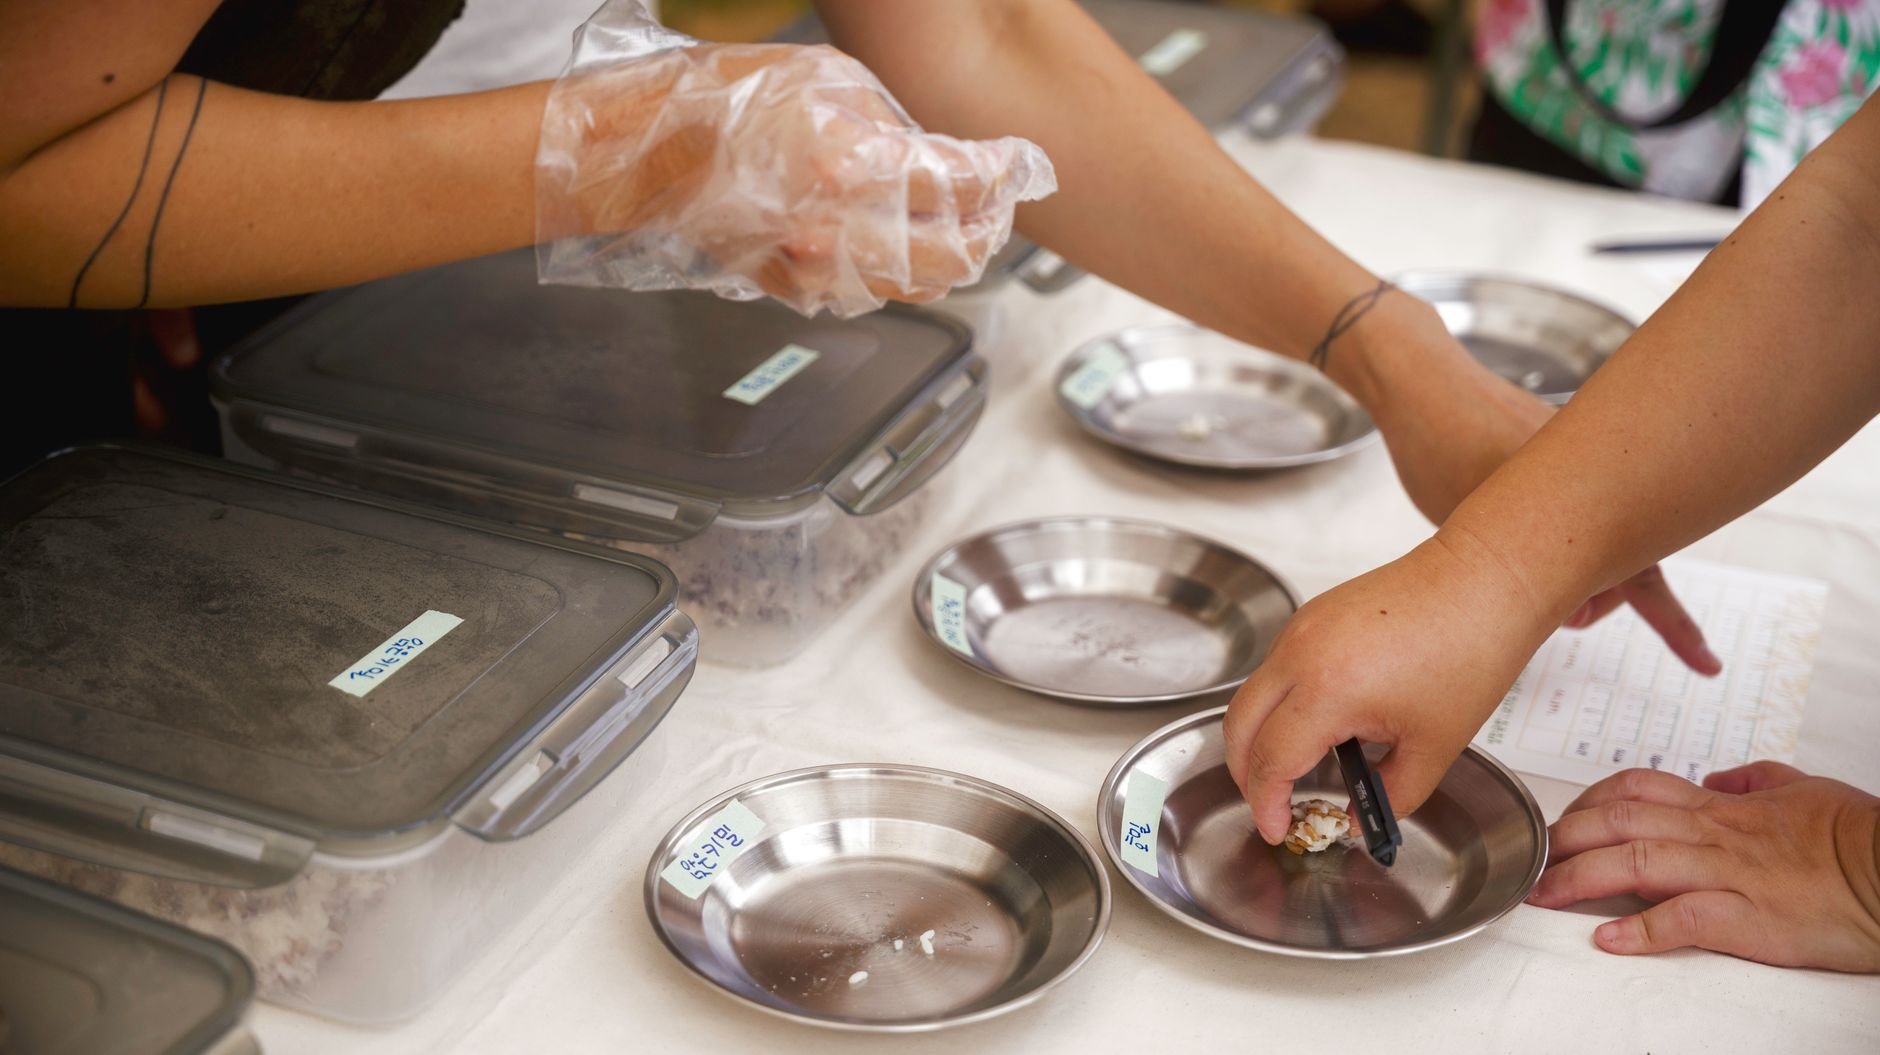
Sorting collected material is where counting turns into classification. Give groups a tray or dish for each kind they decide on, and ask them to justify the groupings aloud. Disagreements are productive: a group that lumps two similar leaves together and another that splits them have each made a decision about what counts as a different species, which is exactly the judgement behind every real biodiversity count. Return living material to where it was found once sorting is finished.
Teaching students to collect data outdoors
Students collect scientific data outdoors most reliably when the method is fixed in advance, the recording format is simple and each task has an owner. Field investigations, data collection and analysis are listed among the practices that Project Learning Tree’s NGSS alignment draws on, so structured outdoor data work sits squarely within standards-based teaching.
Prepare indoors, not in the field
Spend the first part of the lesson inside. Show students the boundary, the tools and the data sheet, and have them rehearse the procedure on a sample. Outdoors, attention scatters quickly, and a class that has practised the routine needs far less correction on site. A well-designed field data sheet template for students removes much of the confusion by laying out exactly what to record and where.
Assign roles and rotate them
- Recorder. Writes every observation on the data sheet, in the agreed format.
- Spotter. Looks closely at the sample area and calls out what is present.
- Measurer or counter. Handles the quadrat, tape or tally.
- Checker. Reads the sheet back to the group before they move on, catching gaps and unreadable entries.
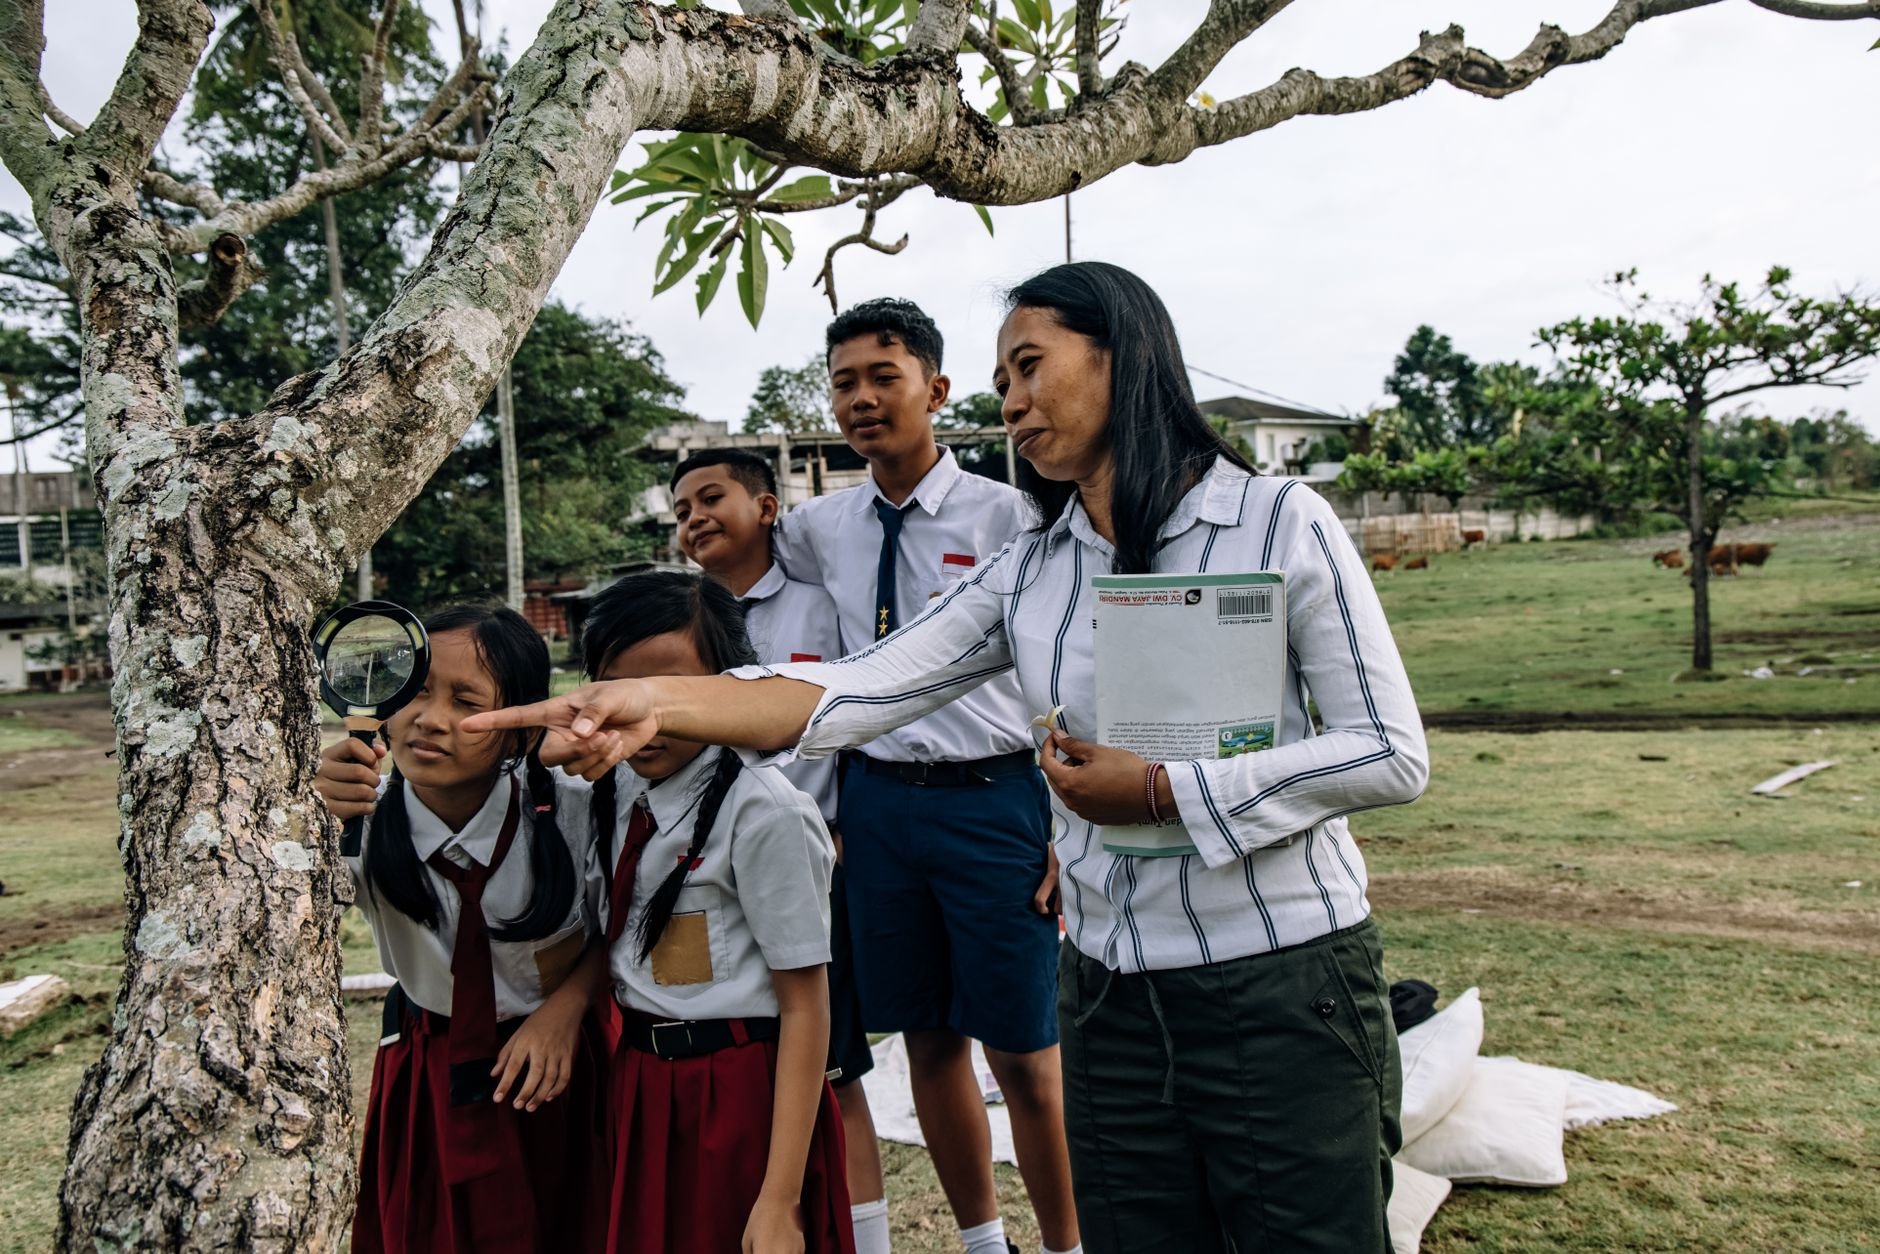
Rotating roles across visits keeps every student involved and lets quieter students practise each skill. It also protects data quality, since the checker role builds a habit of reviewing before leaving the site.
Make notebooks part of the data routine
A sheet captures counts; a notebook captures the reasoning around them. Sketches, notes on weather and habitat, and questions that arise mid-survey all become evidence later. If your students have not kept field notes before, how to teach nature journaling sets out routines that fit alongside quantitative recording rather than competing with it.
Use digital submission where it adds value
Tablets let students photograph an organism, attach a location and share the record beyond the classroom. That is especially useful when identification is uncertain, since others can help confirm it. Look at using inaturalist in the classroom if you want a platform for this, and at citizen science projects for classrooms for broader options where student records contribute to larger datasets. Keep paper backups for the first visit; digital tools reward students who already understand what a good record looks like.
Species identification skills
Identification is the skill that most limits student biodiversity data, so teach it deliberately instead of assuming it will develop on its own. A class that can sort organisms into sensible kinds produces counts worth analysing, even if few students can give every species name.

Build from features, not names
Start by asking students to describe what they see: leaf shape, arrangement, edge, colour, growth form. Descriptions become the vocabulary that guides and keys depend on. A student who has written a clear description can find the match in a reference, while a student who only guessed a name has nothing to check against.
Introduce references in a sensible order
- Illustrated sheets for a small local set. Best for first-time identifiers, because a short list keeps the task manageable.
- Field guides. Suit students who can already group by features and are ready to search a larger range.
- Keys. Suit confident students, since a key asks them to make a series of careful yes-or-no decisions about features.
For techniques and classroom routines, see how to teach species identification to students. Whatever tools you choose, tell students that a confident wrong answer is worse than an honest “not sure” with a photograph and description attached.
Experimental design with field data
Teaching experimental design with field data means turning a survey into a comparison: students pick something that might differ between sites or conditions, decide what they will measure, and plan how to keep everything else as similar as they can. The PLT NGSS alignment lists experiments alongside field investigations and data analysis as core practices, which confirms that fieldwork and experimental thinking belong together.
Start with a question students can actually test
A vague wonder such as “why are there so many plants here?” cannot be answered with one visit. A testable version names what will be compared and what will be measured: for example, whether a mown area and an unmown area differ in the number of plant kinds. Practise turning wonderings into comparisons before fieldwork begins. The guidance in how to write a testable question for ecology project is designed for exactly this step.
Teach the logic of a fair comparison
- Change one thing. The difference between sites is the thing being tested; other differences weaken the conclusion.
- Sample the same way everywhere. Same quadrat or transect, same method, same kind of record.
- Repeat the sampling. A single sample may be unrepresentative. Several samples per site let students see how much results vary.
- Record conditions. Weather, time and habitat notes help explain surprising results afterwards.
Field settings are never perfectly controlled, and this is a teaching opportunity rather than a flaw. Ask students what they could not control and how it might have affected their results. That discussion builds scientific judgement more effectively than an experiment where everything works.
Let predictions come before data
Ask students to write a prediction and a reason before they sample. When the data arrive, they compare what happened against what they expected. A prediction that was wrong is as useful as one that was right, provided students can explain what they learned from the difference.
Analysing and sharing results
Analysis turns a pile of tallies into an answer, and it is the stage most often skipped when time runs short. Protect time for it, even if the fieldwork has to be shorter. A class that collects data and never interprets it learns the procedure but not the point.
Graph first, then discuss
A simple bar graph comparing the number of kinds found at each site is usually enough. Ask students what they notice before telling them what to notice, then push for evidence: which bars differ, by how much, and whether repeated samples at one site agree with each other. Methods and classroom routines for this stage appear in how to analyze ecological data with students.
Write claims that match the evidence
Encourage students to use cautious, evidence-based wording: “In our samples, the unmown area had more kinds of plants” instead of “mowing destroys biodiversity.” Then ask what further data would strengthen or challenge the claim. This habit connects analysis back to the next question, which keeps inquiry cycling rather than ending at a single report.
Connecting to invasive species
Biodiversity fieldwork leads naturally into invasive species observation, because a class that knows what normally lives in an area is ready to notice what does not belong. Run the baseline survey first, then introduce the invasive-species question as an extension rather than a replacement.
Where to go next
- For a structured lesson. The teaching invasive species lesson plan frames the topic around local observation.
- For a management case study. Biological control of purple loosestrife galerucella gives students a worked example of an intervention and the questions it raises.
- For a whole-class event. How to run a bioblitz with students concentrates identification and recording into one organised session.
Standards-based framing helps here. Among the NGSS performance expectations listed by Project Learning Tree is MS-ESS3-3, which asks students to design a method for monitoring and minimizing a human impact on the environment. For high school, HS-LS2-7 addresses reducing the impacts of human activities on the environment and biodiversity. A student survey that tracks a problem species and proposes a response speaks directly to both.
Place-based fieldwork beyond the schoolyard
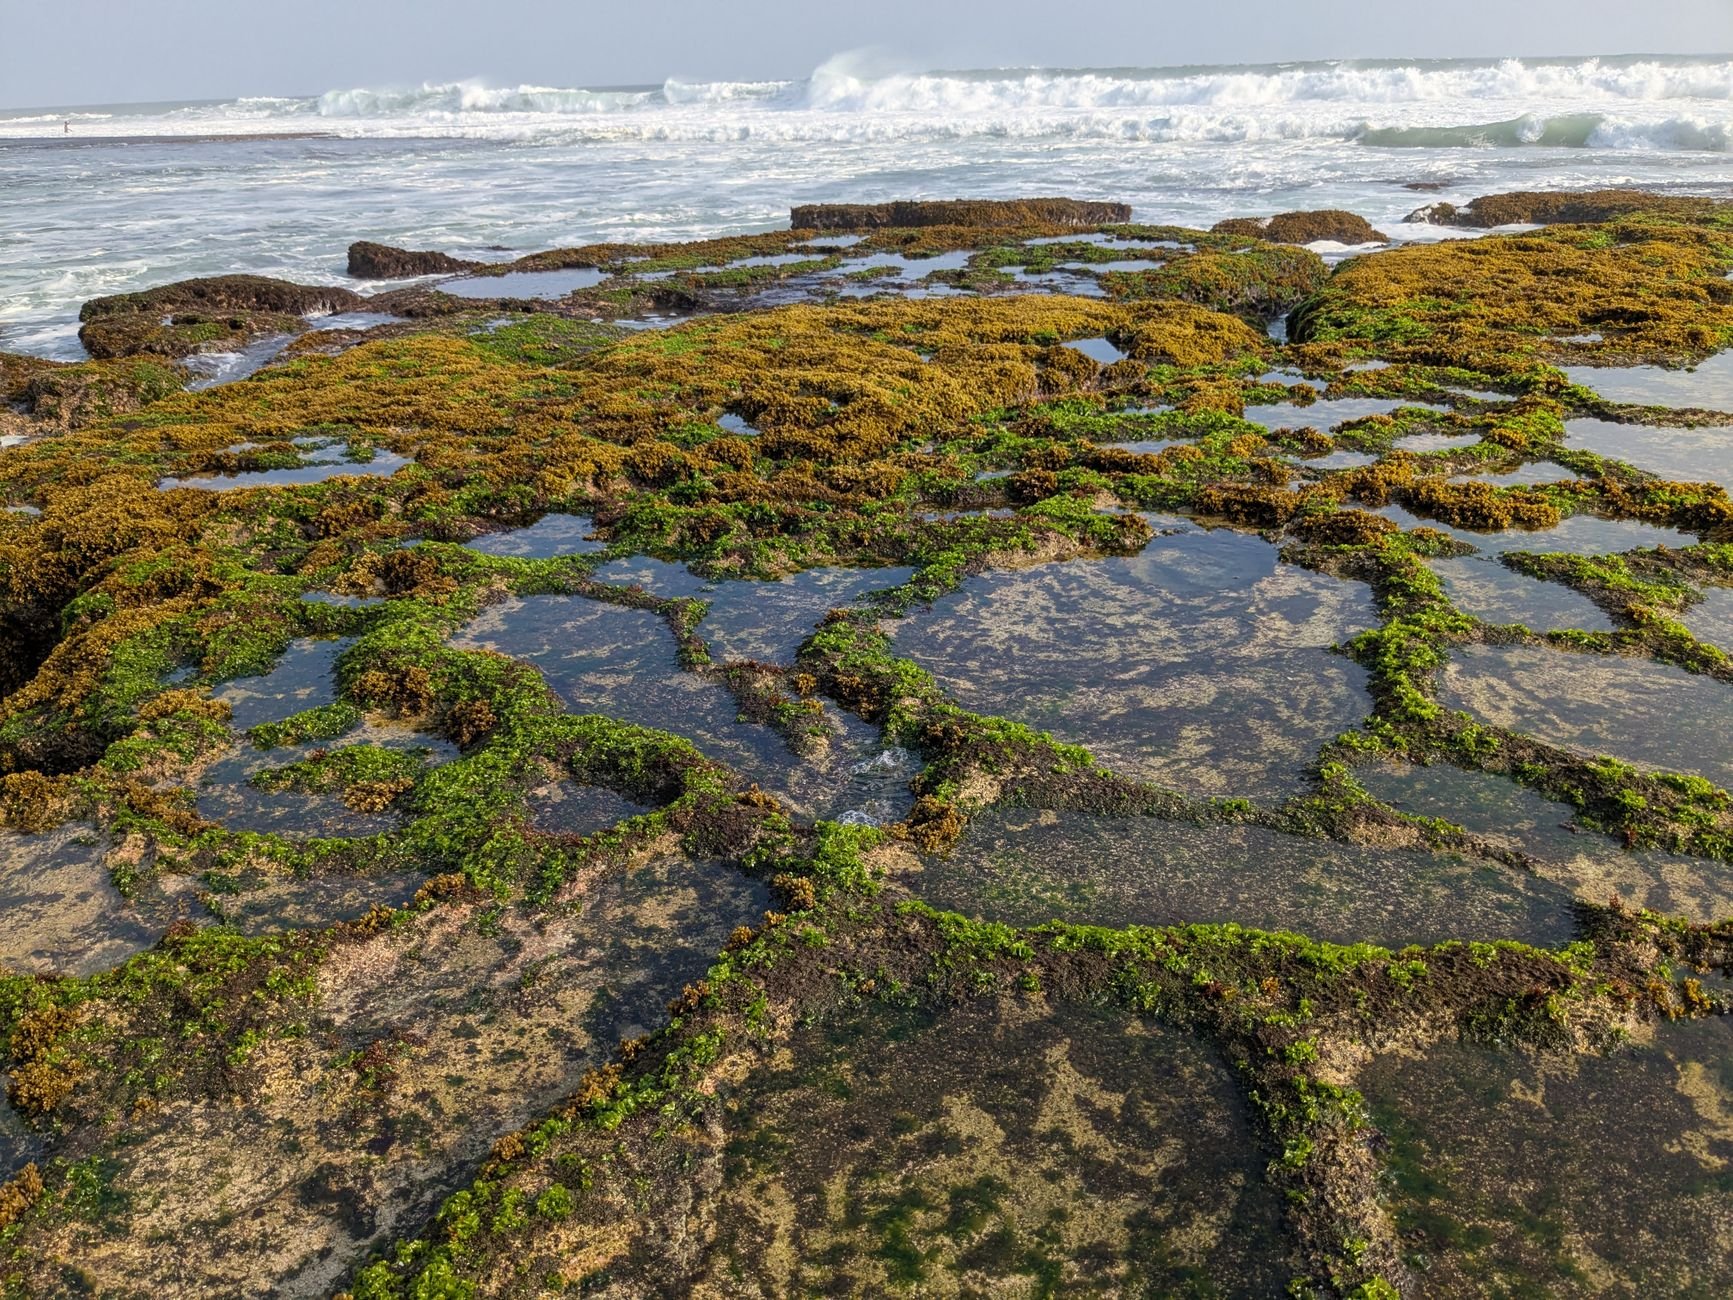
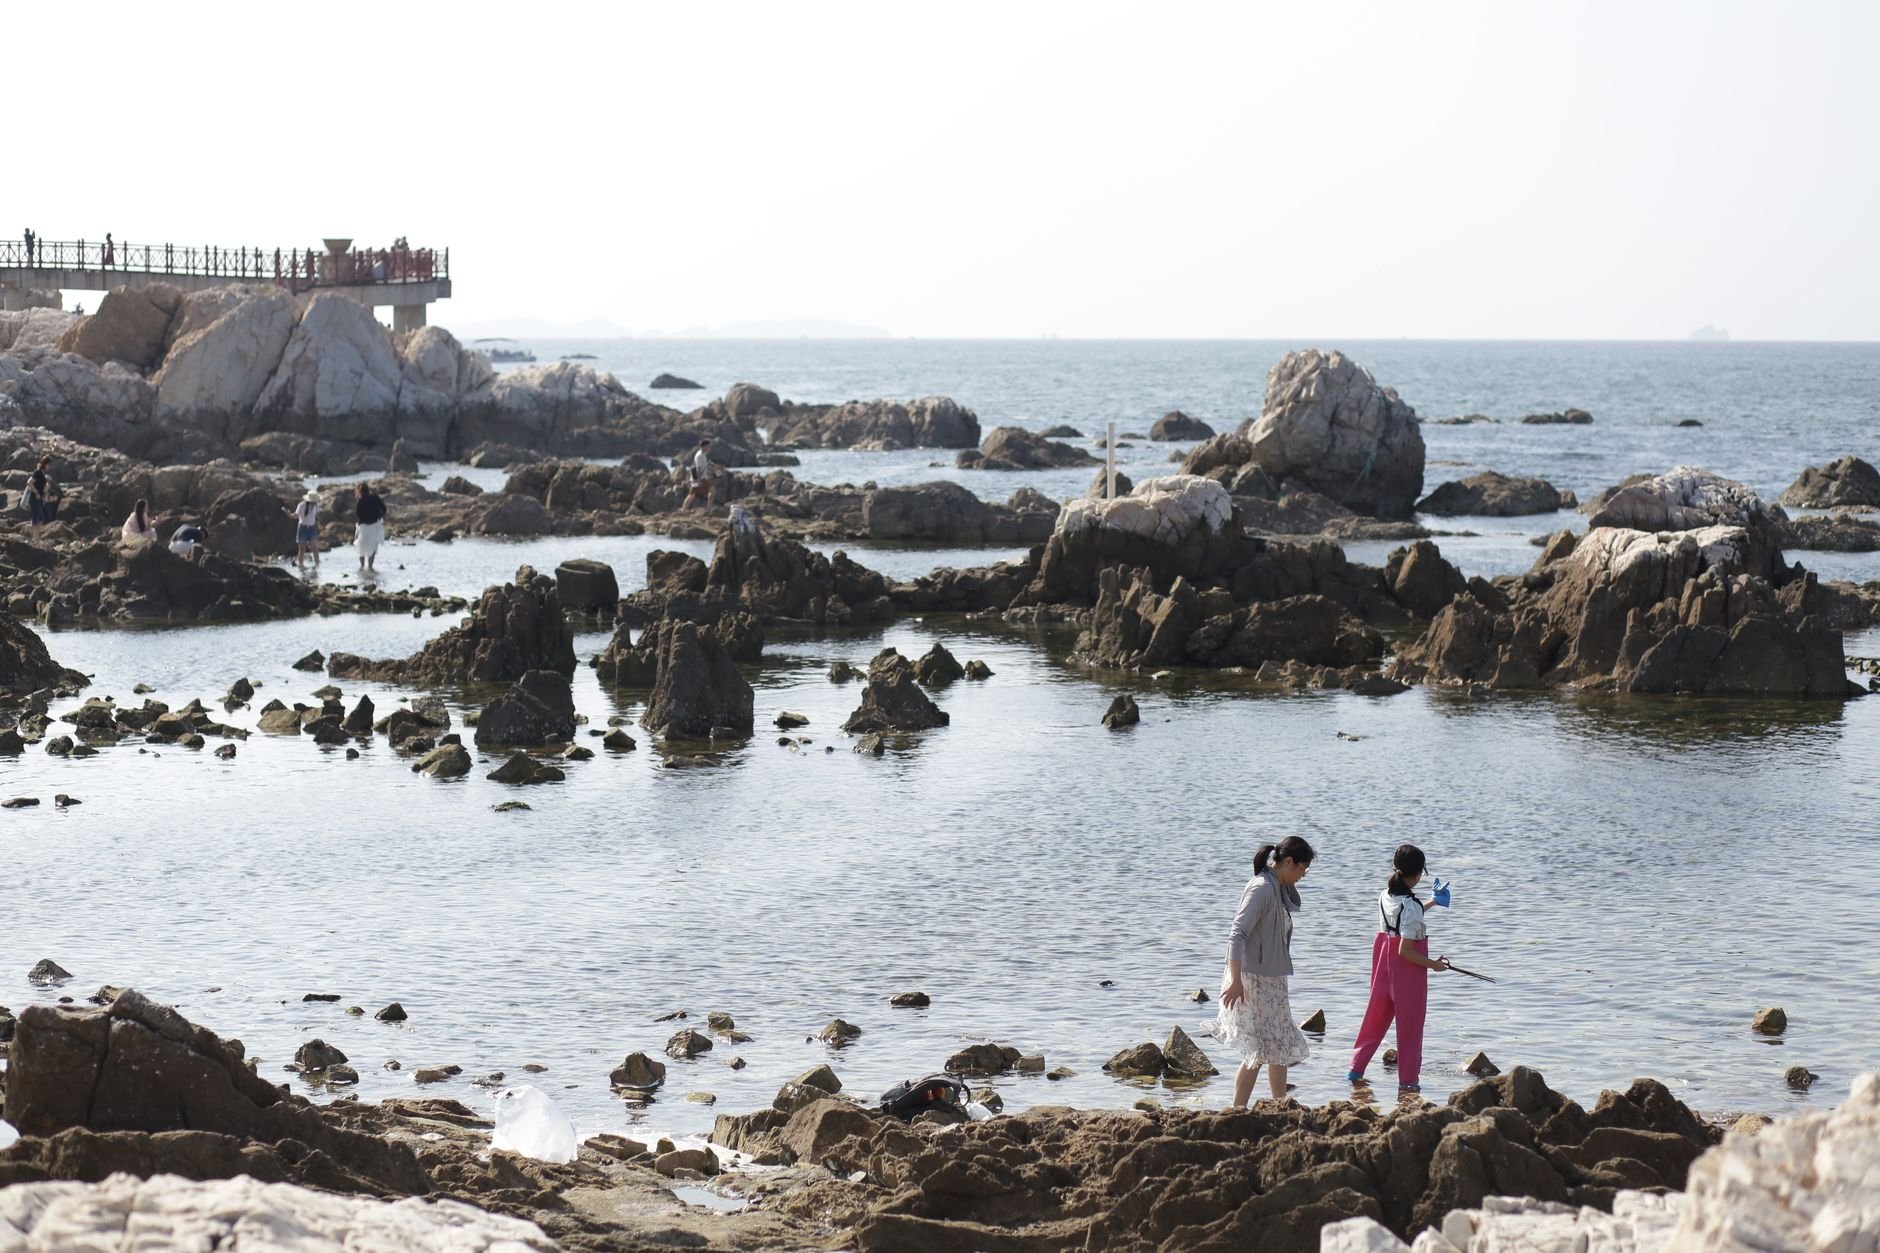
A schoolyard is the simplest field site, but a visit to a different habitat shows students how biodiversity looks when conditions change. A shoreline trip can contrast sharply with a grassy yard, and the contrast itself becomes the lesson.
Plan the trip around the same inquiry routine
Do not let a special site turn into a sightseeing outing. Keep the routine you practised at school: a defined sample area, a shared recording format, assigned roles and a question set in advance. The novelty of the setting will make students eager to explore, so channel that energy into the task by giving them something specific to look for and record before they scatter.
Handle living things with care
Teach students to observe without disturbing more than necessary, to return anything they move, and to follow any site rules. Respectful handling is part of scientific practice, and it keeps sensitive habitats usable for future classes. Check local permissions and safety requirements before any visit to a public or protected site.
Aligning with the Next Generation Science Standards
The Next Generation Science Standards describe performance expectations, which define what students should know or be able to do. Each draws on three dimensions of science: science and engineering practices, disciplinary core ideas and crosscutting concepts, as summarised in Project Learning Tree’s alignment guide. Field biodiversity work engages all three, since students practise investigation methods, learn ecosystem content and apply ideas such as patterns and human impact.
Check the version of standards your state or district uses before writing objectives, since many education departments adopt or adapt standards in their own form. The two expectations below are the ones most directly relevant to biodiversity and invasive species monitoring.
| Performance expectation | Level | What it asks of students | Planning use |
|---|---|---|---|
| MS-ESS3-3 | Middle school | Design a method for monitoring and minimizing a human impact on the environment | Pair with a schoolyard survey or invasive species observation where students plan how to track a change over time |
| HS-LS2-7 | High school | Address reducing the impacts of human activities on the environment and biodiversity | Use after students have measured diversity, so proposals rest on their own field data |
These expectations are drawn from the Project Learning Tree NGSS alignment page.
Using standards without letting them drive the lesson
Write the lesson around the question and the data first, then check which expectations it addresses. Reversing that order tends to produce activities that tick boxes without engaging students. A well-run survey with a real comparison usually meets several practices at once, including collecting and analysing data, so the alignment follows naturally from good teaching.
Frequently asked questions
How do you teach students to collect scientific data outdoors?
Rehearse the method indoors, fix the sample area and recording format in advance, assign rotating roles, and review each data sheet before leaving the site. Notebooks and a field data sheet work best together.
What is biodiversity and how can students measure it?
Biodiversity is the variety of different species within a particular ecosystem or community. Students can measure it by recording and counting the different kinds of organisms found in a defined, consistently sampled area.
How do you teach experimental design with field data?
Turn a survey into a comparison. Students choose one difference to test, sample every site the same way, repeat their samples, record conditions and compare results against a prediction written beforehand.
How long does a biodiversity lesson take?
A concept lesson for grades 7-9 in published classroom material takes 30-40 minutes. Outdoor surveys, analysis and extension projects need additional time, so plan them as separate sessions.
Where should a teacher new to fieldwork start?
Start with observation and notebooks in the schoolyard, then add a simple counting survey. Move to comparisons and invasive species questions once students record data consistently.